In this generation if you are using an Linux System then you should have basic knowledge to debugging on performance side, Hence here I am providing you few commands list with the information of how to use and how the output of that.
As a QA Engineer in Networking domain I am very well aware of the how is hard and needed to know debug an Linux System Performance related problems are coming in the client side along with needed to check during the Performance Testing after being withing the 3 years in IT industry.
These commands are available under all flavors of Linux and can be useful to monitor and find the actual causes of performance problem.
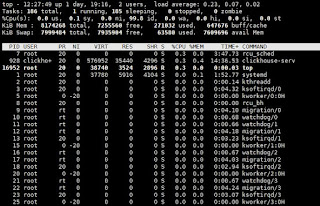
1. Top – Linux Process/Performance Monitoring
Linux Top command
is a performance monitoring program which is used frequently by many system
administrators to monitor Linux performance and it is available under
many Linux/Unix like operating systems. The top command used to dipslay all
the running and active real-time processes in ordered list and updates it
regularly. It display CPU usage, Memory
usage, Swap Memory, Cache Size, Buffer Size, Process PID, User, Commands and much more. It also shows high memory and cpu utilization
of a running processess. The top command is much userful for system
administrator to monitor and take correct action when required. Let’s see top
command in action.
2. VmStat – Virtual Memory Statistics
Linux VmStat command used to display
statistics of virtual memory, kernerl
threads, disks, system
processes, I/O blocks, interrupts, CPU activity and
much more. By default vmstat command is not available under Linux systems you
need to install a package called sysstat that includes a vmstat
program. The common usage of command format is.
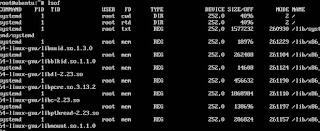
3. Lsof – List Open Files
Lsof command
used in many Linux/Unix like system that is used to
display list of all the open files and the processes. The open files included
are disk files, network
sockets, pipes, devices and processes. One of
the main reason for using this command is when a disk cannot be unmounted and
displays the error that files are being used or opened. With this commmand you
can easily identify which files are in use. The most common format for this
command is.
4. Tcpdump – Network Packet Analyzer
Tcpdump one
of the most widely used command-line network packet analyzer or packets
sniffer program that is used capture or filter TCP/IP packets
that received or transferred on a specific interface over a network. It also
provides a option to save captured packages in a file for later analysis.
tcpdump is almost available in all major Linux distributions.
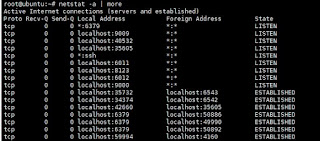
5. Netstat – Network Statistics
Netstat is
a command line tool for monitoring incoming and outgoing
network packets statistics as well as interface statistics. It is
very useful tool for every system administrator to monitor network performance
and troubleshoot network related problems.
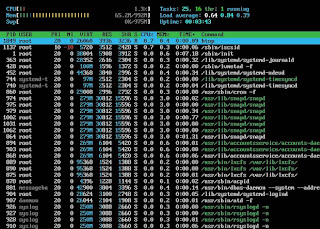
Htop is
a much advanced interactive and real time Linux process monitoring tool. This
is much similar to Linux top command but it has some rich
features like user friendly interface to manage process, shortcut
keys, vertical and horizontal view of the processes and
much more. Htop is a third party tool and doesn’t included in Linux systems,
you need to install it using YUM package manager tool. For
more information on installation read our article below.
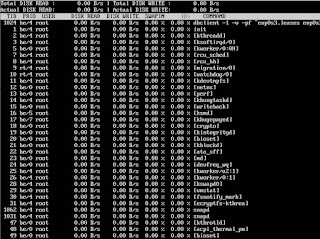
Iotop is
also much similar to top command and Htop program, but it
has accounting function to monitor and display real time Disk I/O and processes. This
tool is much useful for finding the exact process and high used disk
read/writes of the processes.
IoStat is
simple tool that will collect and show system input and output storage
device statistics. This tool is often used to trace storage device performance
issues including devices, local disks, remote disks such
as NFS.
IPTraf is
an open source console-based real time network (IP LAN)
monitoring utility for Linux. It collects a variety of
information such as IP traffic monitor that passes over the network, including
TCP flag information, ICMP details, TCP/UDP traffic breakdowns, TCP connection
packet and byne counts. It also gathers information of general and detaled
interface statistics of TCP, UDP, IP, ICMP, non-IP, IP checksum errors,
interface activity etc.
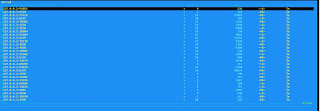
10. iftop – Network Bandwidth Monitoring
iftop is
another terminal-based free open source system monitoring utility that displays
a frequently updated list of network bandwidth utilization (source and
destination hosts) that passing through the network interface on your system.
iftop is considered for network usage, what ‘top‘ does for CPU usage. iftop is a ‘top‘ family
tool that monitor a selected interface and displays a current bandwidth usage
between two hosts.

